In today's economy, the ability to leverage data is a significant competitive advantage. Businesses are investing heavily in tools and teams to become more "data-driven." However, simply having data is not enough. The path to actionable insight is riddled with common pitfalls that can lead to misguided strategies, wasted resources, and a false sense of confidence.
An incorrect conclusion drawn from a flawed analysis can be far more dangerous than relying on intuition alone. Here are five of the most common data mistakes and how your business can avoid them.
1. Relying on "Dirty" Data (Garbage In, Garbage Out)
Every analysis is built on the assumption that the underlying data is accurate, complete, and consistent. If your data is riddled with duplicates, missing values, or formatting errors, any conclusion you draw will be unreliable at best and dangerously wrong at worst.
The Impact: Imagine trying to forecast sales based on a dataset where 20% of the entries are duplicates. Your forecast will be artificially inflated, leading to poor inventory and budget decisions. This erodes trust in the data and the teams that manage it.
The Solution: Prioritize data quality and governance. Implement automated data validation checks at the point of entry and conduct regular data cleaning audits. Treat your data as a critical business asset that requires maintenance.
2. Confusing Correlation with Causation
A correlation simply means that two variables tend to move in the same direction. Causation means that a change in one variable causes a change in another. The two are not the same. A famous example is the correlation between ice cream sales and shark attacks—they both rise in the summer, but one does not cause the other. The hidden cause is the warm weather.
The Impact: Mistaking correlation for causation leads to faulty conclusions and wasted effort. You might invest heavily in a marketing channel that appears correlated with high-value customers, only to find it had no actual impact on their decision to buy.
The Solution: Be skeptical. When you see a correlation, ask, “Could a third, unobserved factor be causing both of these things?” The gold standard for establishing causation is controlled experimentation, such as A/B testing, where you can isolate a single variable.
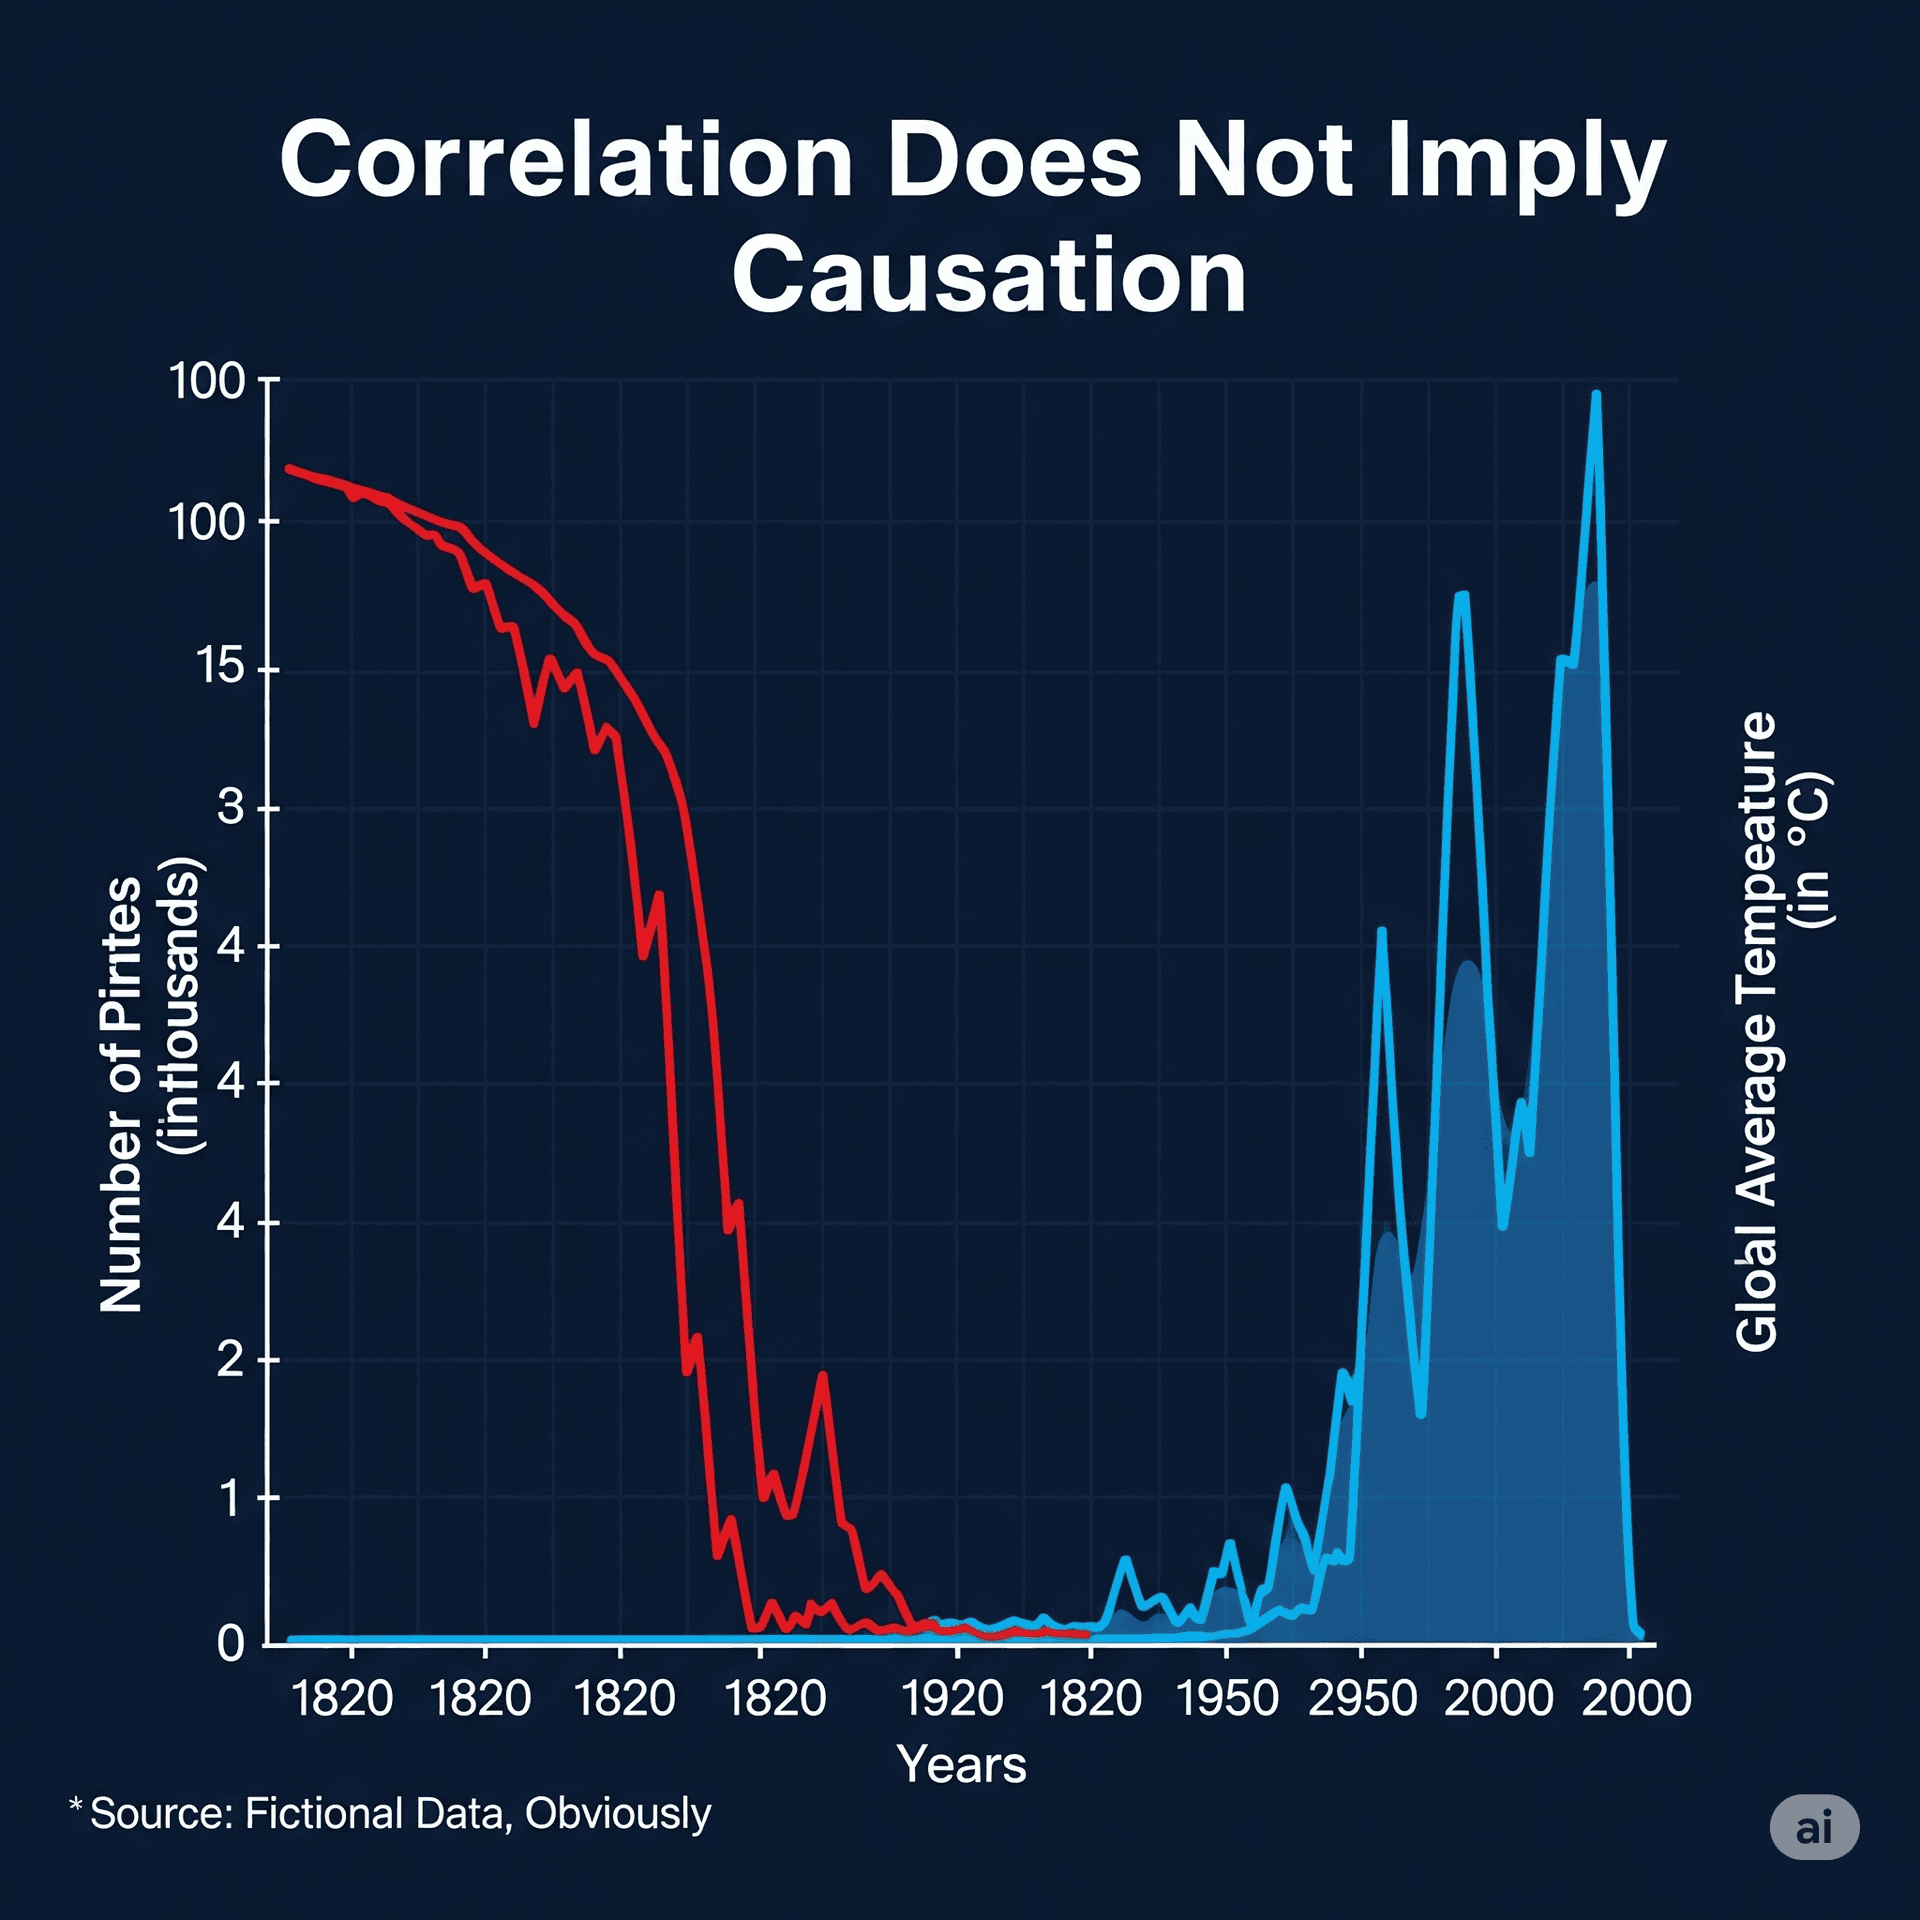
Fig 1: An example of spurious correlation demonstrating why causation must be tested, not assumed.
3. Ignoring Qualitative Data (The "Why")
Quantitative data shows you what is happening, but it can’t tell you why. For example, numbers may reveal that 70% of users drop off at your payment page, but not whether it’s due to slow loading, hidden costs, or confusing forms.
The Impact: You risk solving the wrong problem. You might spend months optimizing page speed when the real issue was a lack of trusted payment options.
The Solution: Combine quantitative analysis with qualitative methods like user surveys, feedback forms, and interviews to uncover the "why" behind the numbers.
4. Chasing Vanity Metrics
Vanity metrics look impressive but don’t reflect true business health. They are easy to measure and feel good to report, but they can be dangerously misleading.
The Impact: Celebrating 1M app downloads while ignoring a 95% churn rate is meaningless and can lead to misguided strategies.
The Solution: Focus on actionable metrics tied directly to your business objectives.
| Vanity Metric (Looks Good) | Actionable Metric (Is Good) |
|---|---|
| Total Sign-ups | Monthly Active Users (MAU) & Retention Rate |
| Page Views | Conversion Rate & Time on Page |
| Social Media Followers | Engagement Rate & Click-Through Rate |
5. Starting with Data Instead of a Question
Dumping all your data on an analyst and saying “find something interesting” is inefficient. Without a clear question or hypothesis, analysis becomes unfocused and rarely produces actionable insight.
The Impact: This wastes valuable resources on generic observations rather than solving critical business problems.
The Solution: Always start with a specific, testable question. For example: “Do users who complete onboarding have higher 30-day retention than those who skip it?”
Data can be a powerful engine for growth, but only when used with discipline and critical thinking. Avoiding these mistakes builds a robust data culture that turns information into a true competitive advantage.